Machine Learning
Welcome, Vectory: Handle embedding experiments faster and smarter
Oct 25, 2022
Handling embeddings is something every machine learning engineer who has worked on computer vision or natural language processing has done.
If you are one of them, the following observations won’t come as a surprise, and we are sorry to bring these memories back. If you are yet to work with embeddings, consider yourself lucky, and use this as a warning of what lies ahead.
During experimentation, it’s easy to get lost in how datasets were built, what models were used, and what the results were; tracking is messy. Once you have a good result, you need to start iterating, tuning, and refining until you get a better version.
But, how can you be sure an embedding is better than another one? If you are lucky, you can use metadata such as classes and tags, then search for the nearest neighbors and check whether they share the same class or tag.
Unfortunately, even in these cases, the computations required are expensive and complex to implement. If you were to build visualizations and more sophisticated comparison techniques to get a robust evaluation, this investment would become far more significant.
At Pento, we had to deal with challenges like these repeatedly. After a while, we got the hang of it and decided to encapsulate our tools in a single place. That is how Vectory was born, and we have been using it internally for a while now.
As we got new challenges, we were able to iterate it and expand its functionalities. There is still a lot of room for improvement and new features. Still, it is important for us to make it accessible to everyone and hopefully make the process of working with embeddings less tedious.
Working with Vectory you will be able to:
Track embedding spaces, as well as all the datasets and experiments associated
Compare any two embedding spaces of your choice using quantitative and qualitative methods.
Visualize embeddings to observe clusters and outliers, and get a better sense of data.
Vectory is a tool made for and by machine learning engineers who want a light and easy way to track and compare embeddings. Let’s go over what makes Vectory, Vectory:
Easy: Just load your data and take advantage of its features, including a visualization Streamlit app.
Big dataset? No problem: Vectory uses Elasticsearch (a high-performance search engine) to index your embeddings in order to handle large amounts of data.
Fast: Elasticsearch speeds up the computing of the algorithms you need.
Real applications: We actually came up with and created Vectory because we needed it on some of our own projects. Vectory is beneficial not only for tracking and visualization but also for similarity searches, comparing spaces, and so on!
Robust: it is thoroughly tested, and we aim to support it as much as possible, continuing its development and solving issues as they arise.
How to use Vectory
First of all, these are the three main concepts of Vectory: datasets, experiments, and embedding spaces.
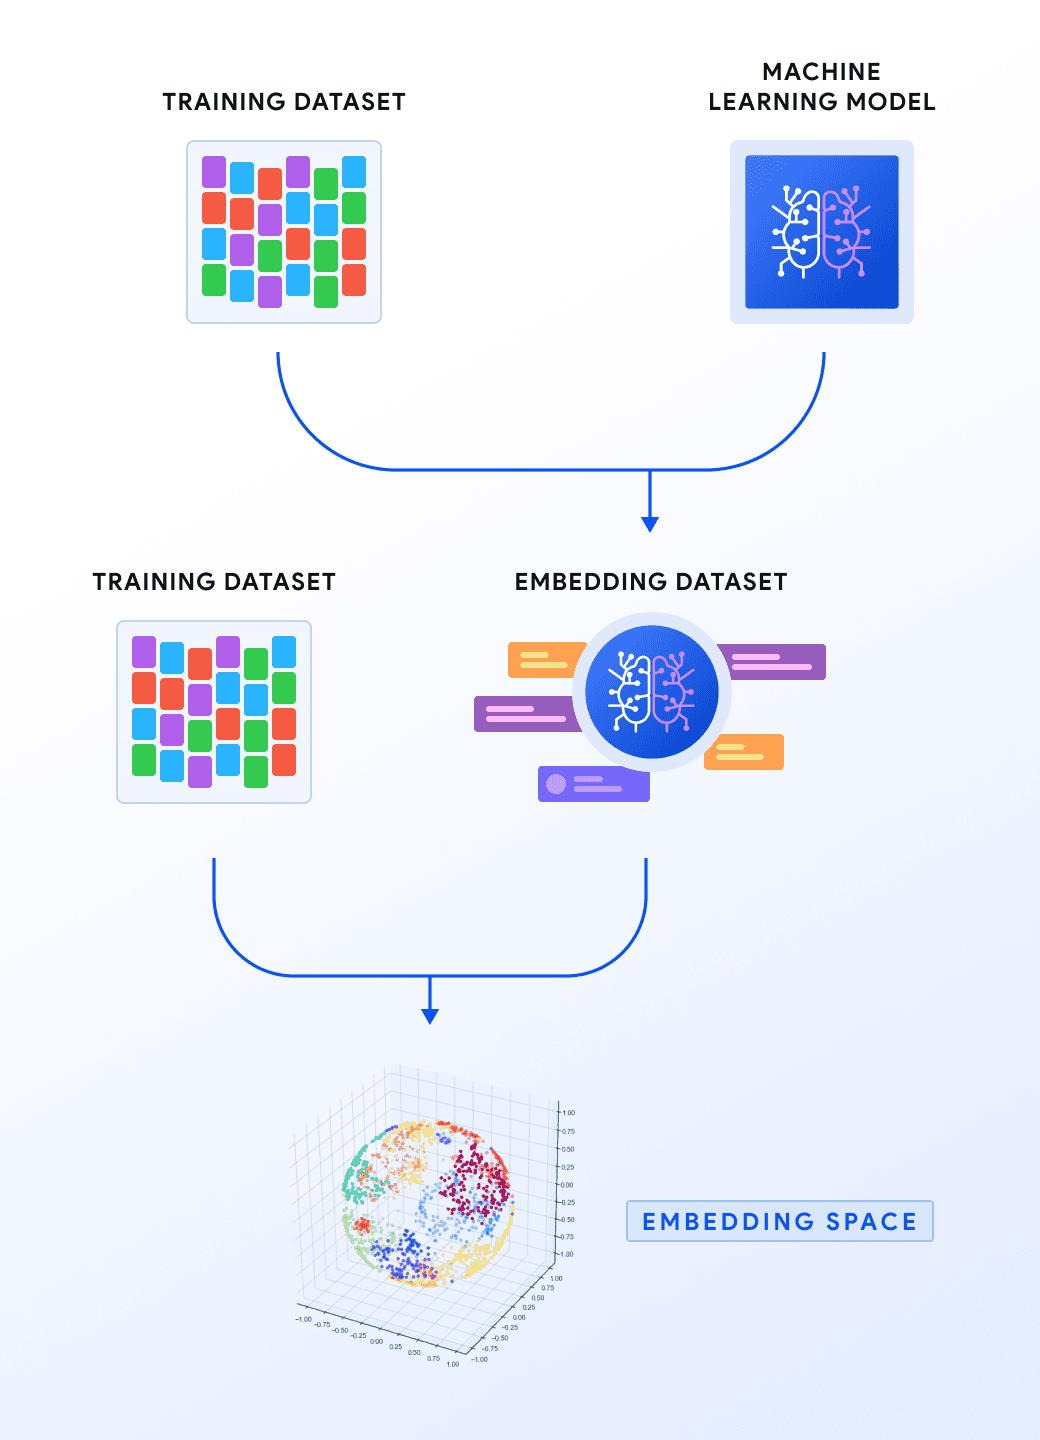
Dataset: A collection of data, used for evaluation or for training purposes.
Experiment: A machine learning model which has been trained with a particular dataset. You can create different experiments by varying the model and the training dataset.
Embedding space: An array with all the generated vectors for a particular dataset using a particular experiment.

Vectory Workflow
For you to get a better understanding of the Vectory workflow, we will describe a general application of it. For an even better understanding, go to the Use Case section!
Suppose that from some dataset we generated several embedding spaces with trained machine learning models. In fact, some models have the same architecture but are trained with different datasets, and different hyperparameters.
We want to choose the best embedding space for this particular dataset. The best way to do this is by tracking the embedding spaces, comparing them and finally, choosing the best embedding space for our use case. Here is where Vectory comes in: a fast and easy way to track these embedding spaces.
To track them, we will add everything to Vectory. Subsequently, we will calculate how similar these embedding spaces are between them, and visualize them to compare them qualitatively.
After we have already compared them quantitatively and qualitatively, we will choose the one which suits better for our use case. We will be able to track down the model, the training dataset of the model, and the hyperparameters with Vectory.
Vectory Usage
Now that we got that straight, let’s start to use it:
All you need for Vectory to run is to install the package and Elasticsearch. You can install the package using pip:
$ pip install vectory
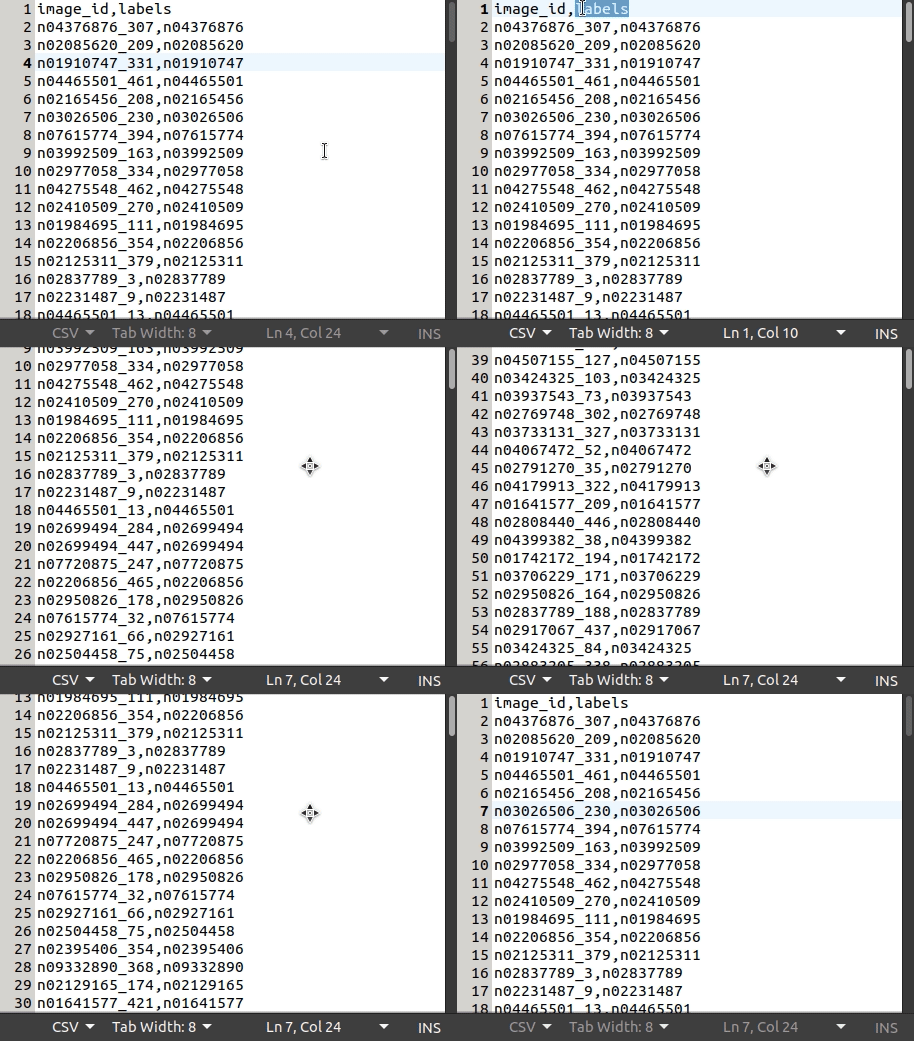
Before you load anything: Vectory only accepts dataset in csv format, and embeddings saved in NumPy arrays as .npy and .npz files.
This is what the tiny-imagenet-200 dataset csv file looks like:

The following code snippet will help you to transform a tensor to a NumPy array:
import tensorflow as tfa_tensor = tf.constant([[1, 2], [3, 4]])an_array = a_tensor.numpy()path = “some/path”np.save(path, an_array)
Now, you can track datasets, experiments and embedding spaces with Vectory. One line in the terminal will do.
You only need to specify the dataset’s path and the embedding’s path. However, it is recommended to specify the experiment name and, if you have it, the name of the dataset the model was trained with in order to correctly track your data.
With --load Vectory loads the embedding space to Elasticsearch right away.
$ vectory add --input [path_to_csv] --embeddings [path_to_npz] –-experiment-name [experiment_name] --train-dataset [train_dataset_name] --load
You can list and track everything added to Vectory by running:
$ vectory ls
Here, you can also check all the information regarding the datasets, the experiments, the embedding spaces and the Elasticsearch indices.
To establish which embedding space to use for a particular dataset, it is best to analytically compare the embedding spaces. Vectory computes the similarity between two embedding spaces of your choice with a variety of metrics, and optionally displays a similarity histogram.
The similarity between two embedding spaces is computed as the mean of the local neighbor similarity of every point, which is the IoU of the ten nearest neighbors. This similarity measure is based on this paper.
At the moment, Vectory won’t decide which embedding is better for your use case, you will have to choose on your own, hopefully using the information Vectory provides you.
$ vectory compare embedding_space_a embedding_space_b
All set, you can visualize the embeddings.
In the console run the visualization with the following command:
$ vectory run
You have to specify the dataset, the embedding spaces you want to visualize, the parameters for the kNN search and the dimension reduction technique for visualization. With this information Vectory will plot the two embeddings spaces in two dimensions.

If you scroll down even more, you will find the histogram of the IoU of the 10 nearest neighbours of the two embedding spaces.

Select any embedding in one of the plots, and query the 10 nearest neighbours in each embedding space. Also, these 10 nearest neighbours in each embedding space are plotted in red as it shows in the following image.

Use case
We will walk through an entire use case: finding a great embedding space for the tiny-imagenet-200 dataset.
We will analyze an embedding space created with a pretrained resnet50 and the other with a pretrained convnext.
Suppose we already installed Vectory and set up Elasticsearch. We will track the embeddings separately.
$ vectory add -i /data/tiny-imagenet-200-data.csv --dataset-name tiny_imagenet --experiment-name resnet_exp --train-dataset tiny_imagenet --model-name resnet50 -e data/resnet50_embedding.npy --embedding-name resnet50_embedding$ vectory add -i /data/tiny-imagenet-200-data.csv --dataset-name tiny_imagenet --experiment-name convnext_exp --train-dataset tiny_imagenet --model-name convnext -e data/convnext_embedding.npy --embedding-name convnext_embedding
Now we will load these embeddings independently to Elasticsearch.
$ vectory embeddings load convnext_embedding convnext_embedding --model lsh --similarity euclidean$ vectory embeddings load resnet50_embedding resnet50_embedding --model lsh --similarity euclidean
These two embeddings have been loaded to ElasticSearch. To verify this we can run:
$ vectory embeddings list-indices
If we want to compare both of these embeddings for posterior use, we run:
$ vectory compare resnet50_embedding convnext_embeddingresnet50_embedding euclidean convnext_embedding euclideanThe mean of the Jaccard similarity for each query is 0.00978131983427649
Since the similarity measure goes from 0 to 1, we can conclude both embedding spaces are not similar at all.
To have more insight into the embedding spaces, we will visualize them. This will give us the opportunity to make a qualitative comparison.
$ vectory run
First, we will determine the parameters of the visualization. In this case we chose for both embeddings the lsh model and the cosine similarity function for kNN search, and the UMAP for dimension reduction.

After we submit this information, the plots of the embedding spaces will appear on screen.

Scrolling down, we’ll see a histogram of the similarity of these two embedding spaces.

Now, we will choose a point in the plot of one of the embedding spaces. A query the 10 nearest neigbours will appear if we scroll all the way down, and also the same two plots with these 10 nearest neighbours colored in red.
This is useful to check on the images that are near to the one chosen in order to understand the backbone of our embedding spaces. To illustrate this, we will check on the images of four of the nearest neighbours.
Now we know our embedding space places the embedding of tractor images near each other.
Conclusion
If you need to compare embedding spaces, if you are struggling with large amounts of data, or if you need to track your embedding spaces with the models and the train dataset used to create them, Vectory is the tool you need.
At Pento we use it all the time, and we just love it. Nonetheless, if you’d like us to work on any particular feature, please let us know by creating an issue on GitHub. Install it and begin to work smarter around embeddings. Feel free to tell us what you think! And of course, if you build something using it, share it with us!
stay in the loop
Subscribe for more inspiration.

